Data Structures & Algorithms With Python
Kent D. Lee & Steve Hubbard
My statistical toolkit has been built project by project. Below are the packages I actually use, in contexts where defaults break: mixed models with complex variance structures, multivariate abundance data, functional diversity indices, Bayesian hierarchical models. The resources section is kept for students and ECRs who find it useful.
Ecological data is messy: different species sampled at different rates, environments that vary in ways that matter statistically, thousands of observations that need to be compared across different conditions. Below are the tools I use to deal with that honestly. The resources section has guides and references for anyone getting started with R.
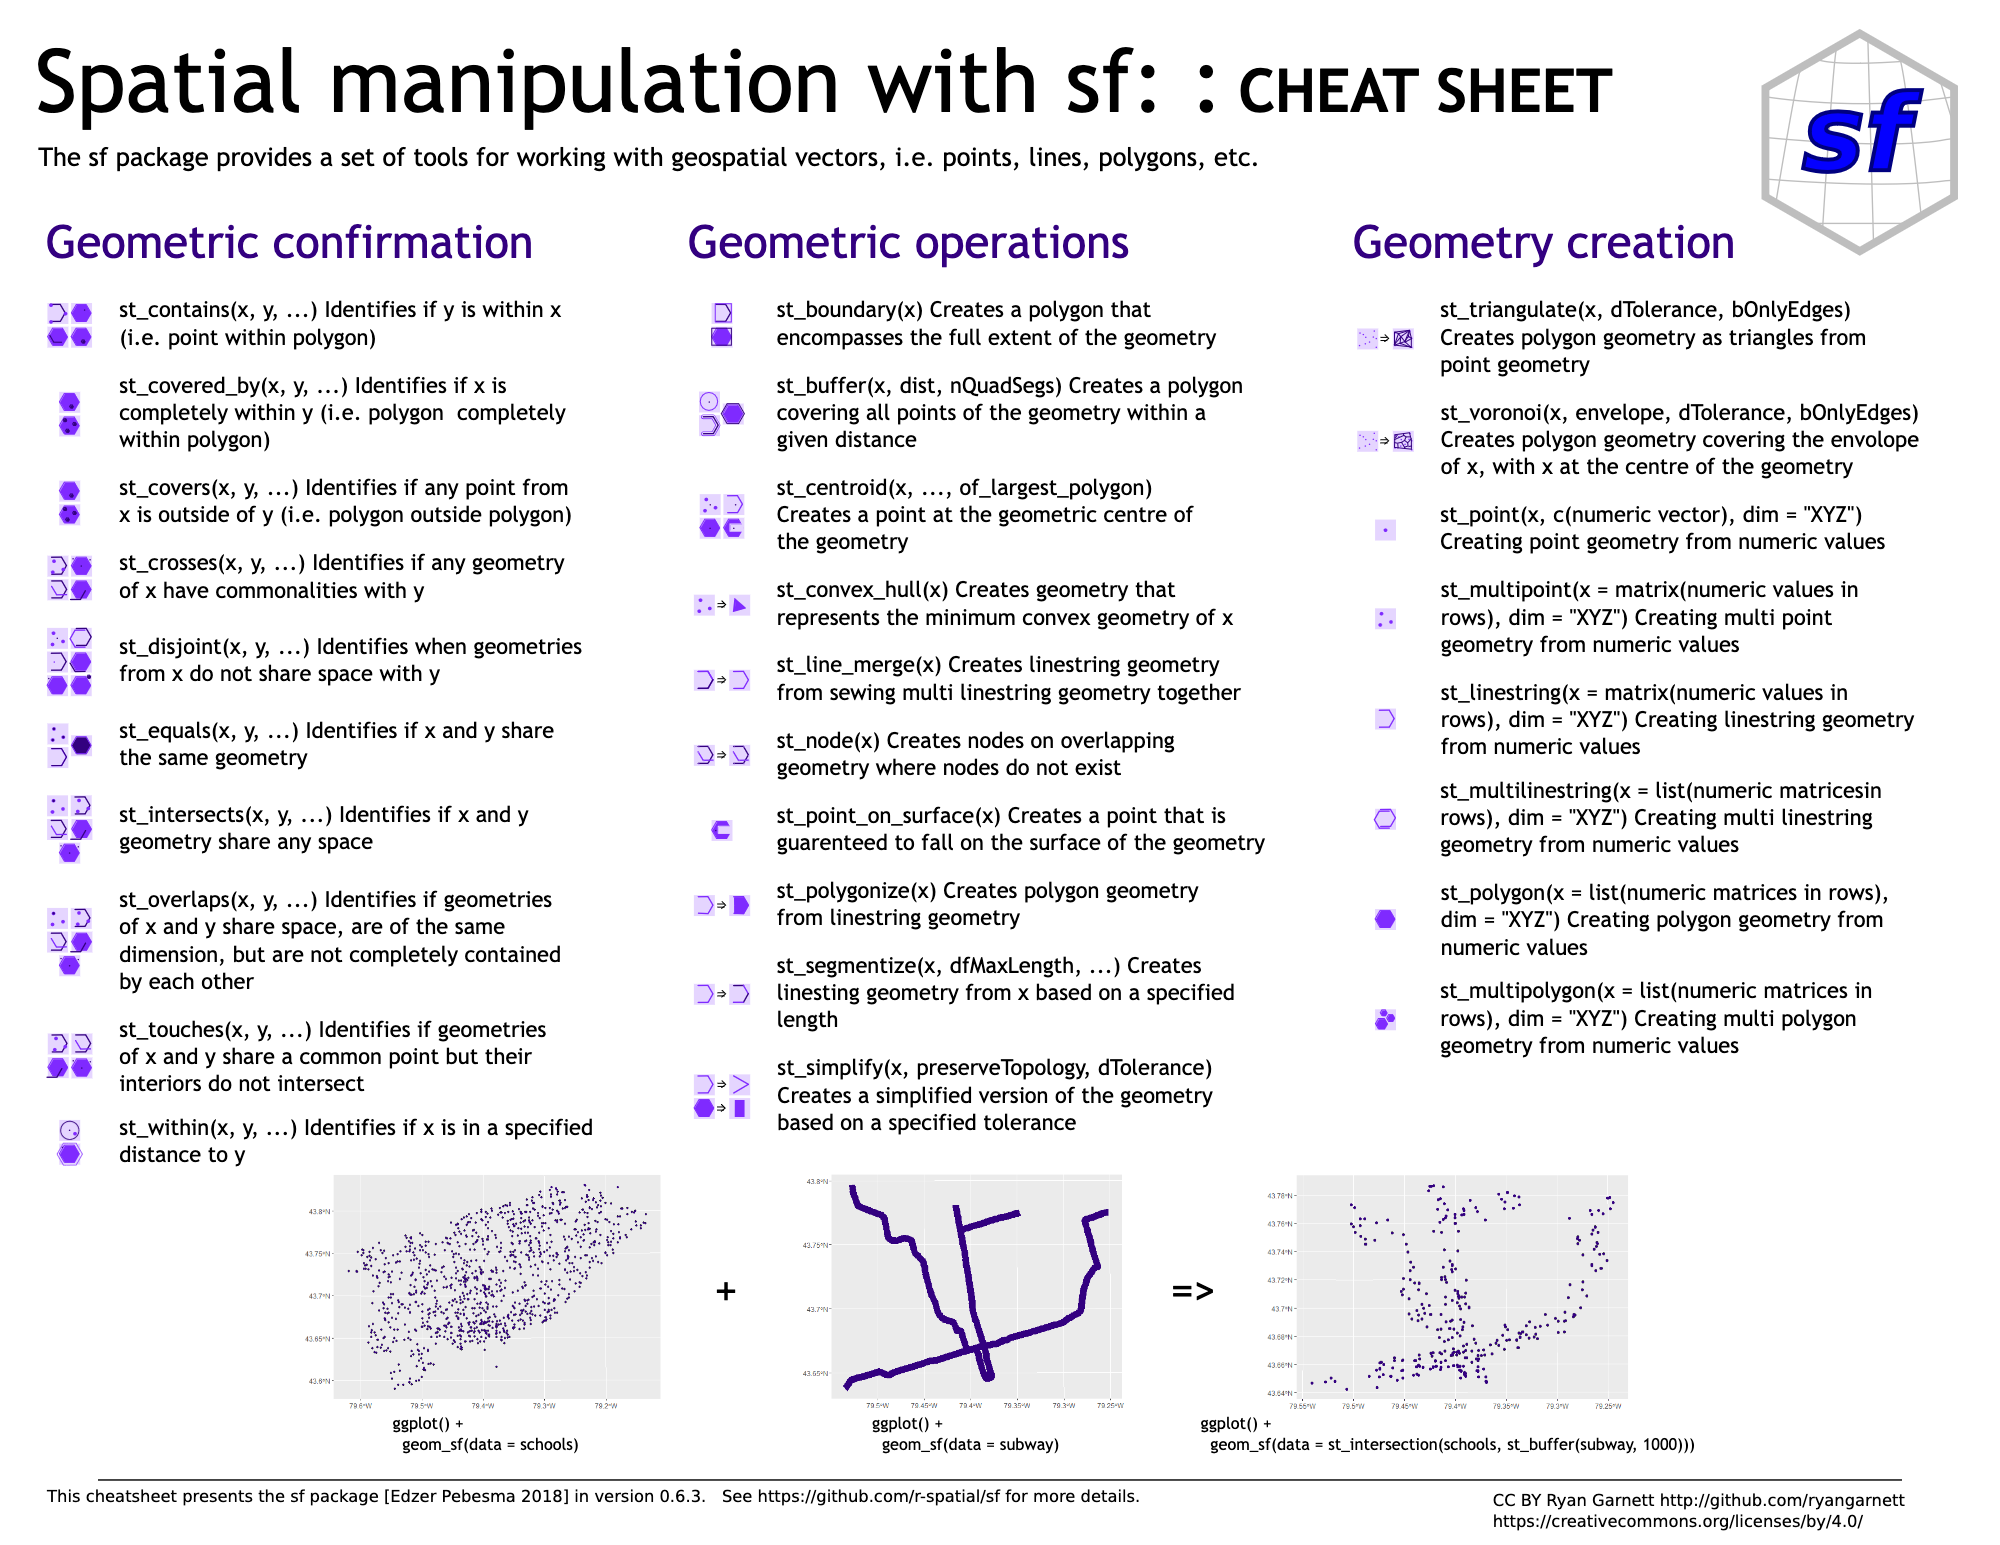
My quantitative work spans community ecology (PERMANOVA, constrained and unconstrained ordination via vegan), mixed-effects and GLS models for heteroscedastic biological data (nlme, following Zuur protocols), generalised linear latent variable models for multivariate abundance data (gllvm), functional trait analysis including community-weighted means and trait-based dissimilarity (FD, betapart), and Bayesian modelling (brms). Analyses are organised into reproducible pipelines using targets.
I maintain an open archive of TidyTuesday data visualisation projects — weekly practice in exploratory analysis, ggplot2, and communicating data clearly. All code is public: github.com/tjw-benth/TidyTuesday.
A showcase of my data analysis and visualization projects from TidyTuesday, a community data science initiative. You can explore all of my projects in my GitHub repository.
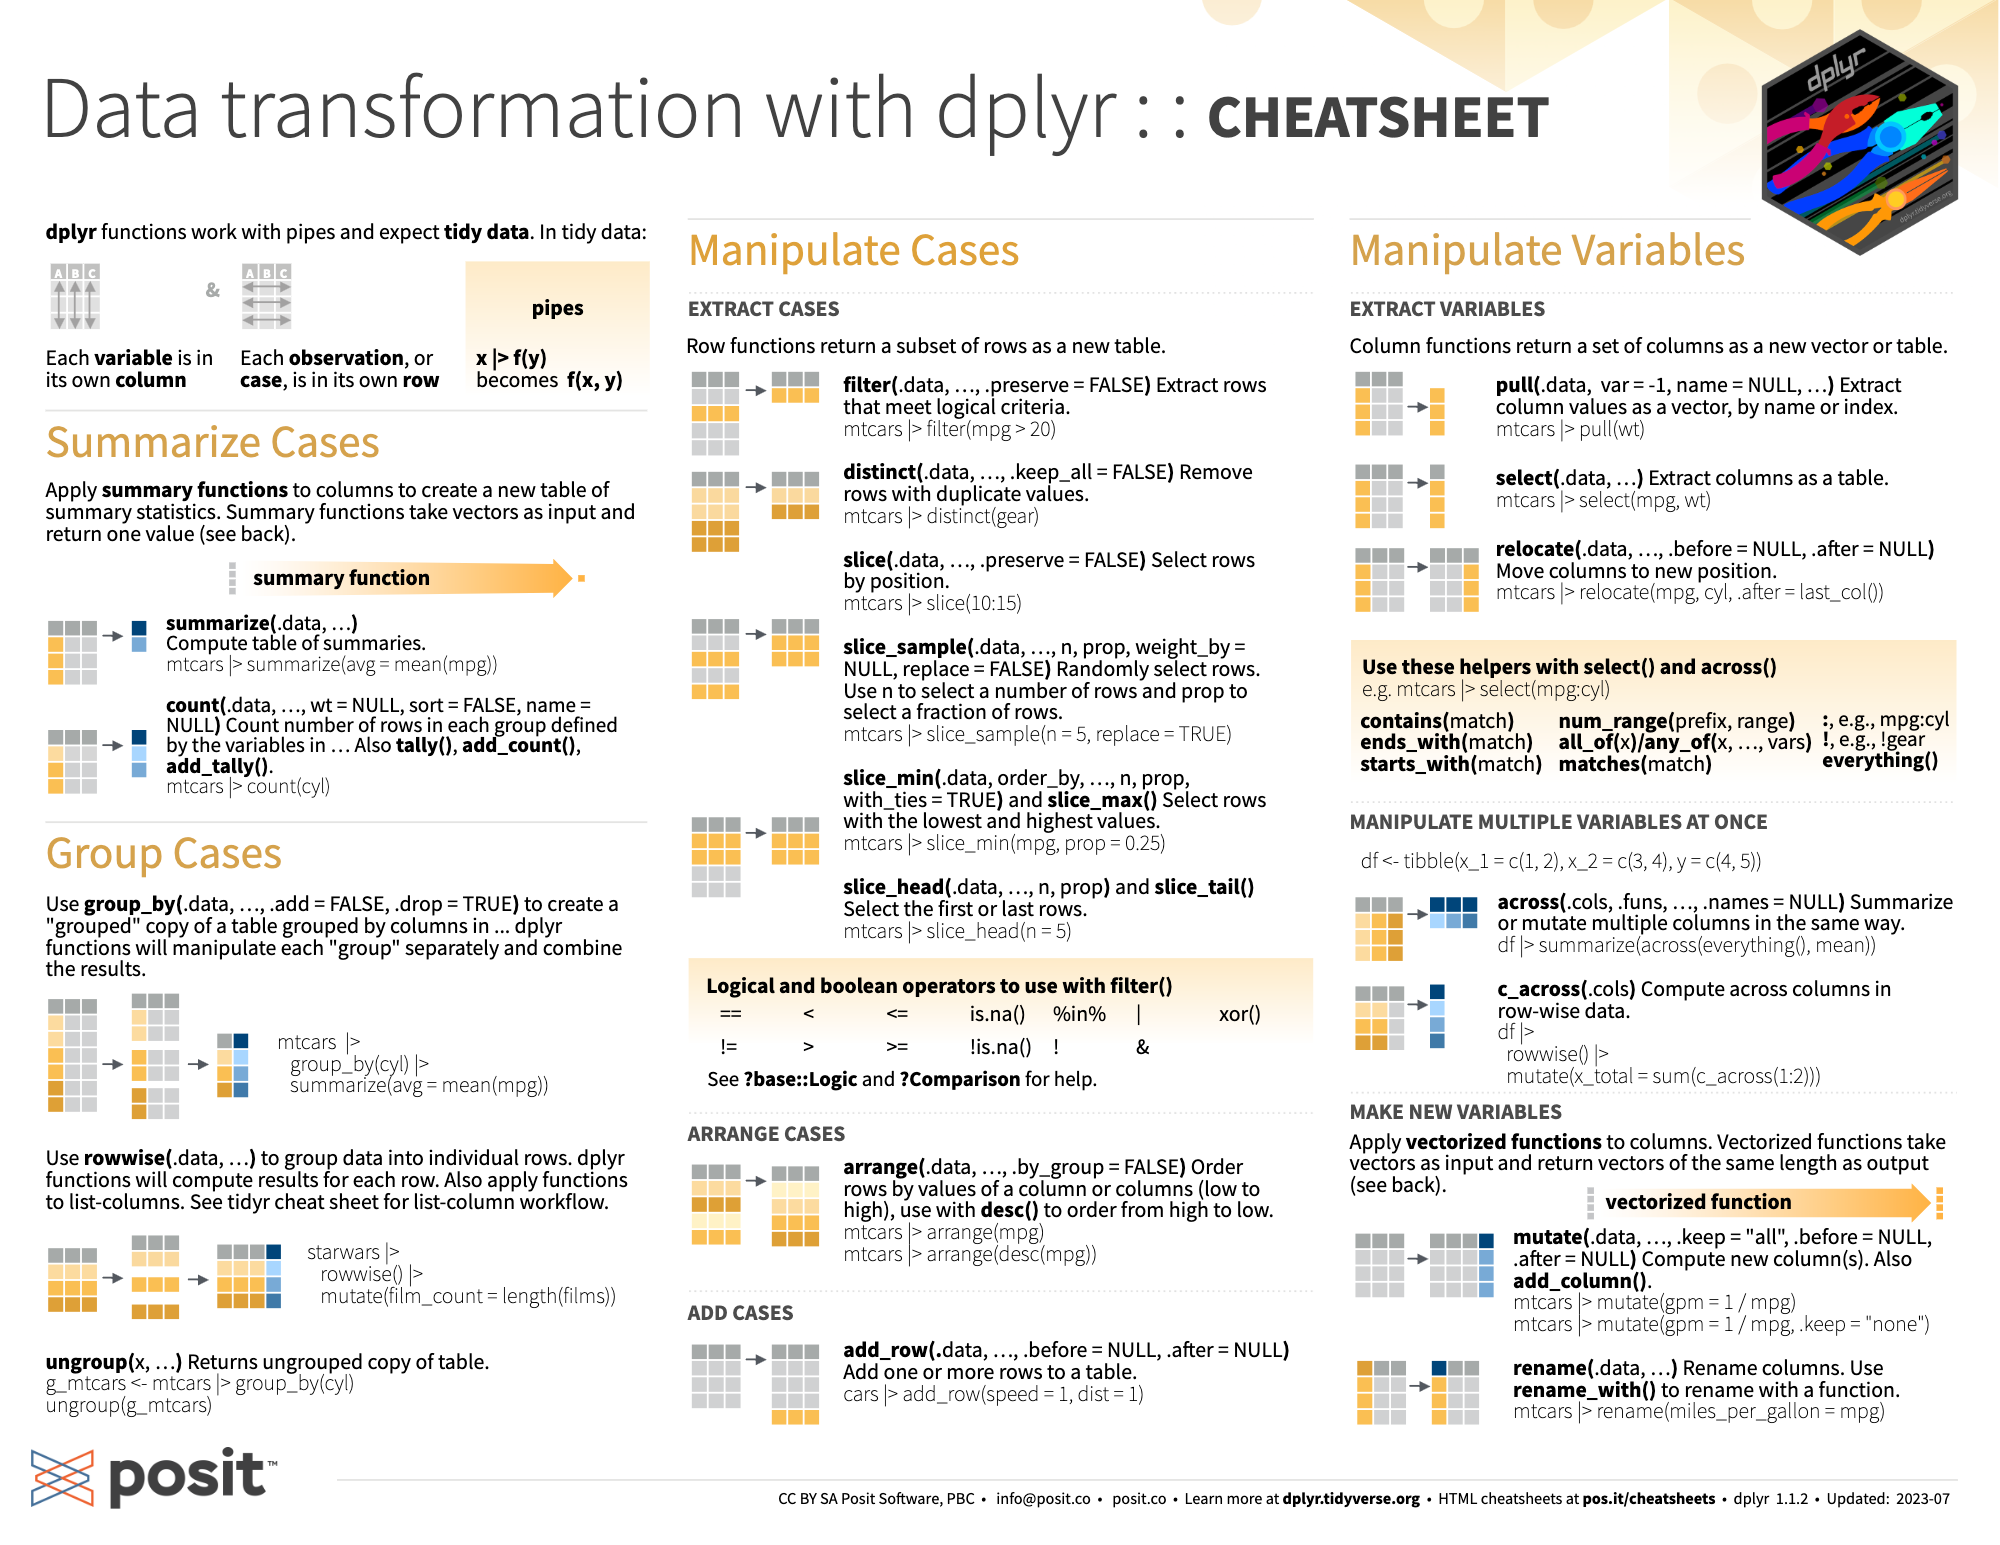
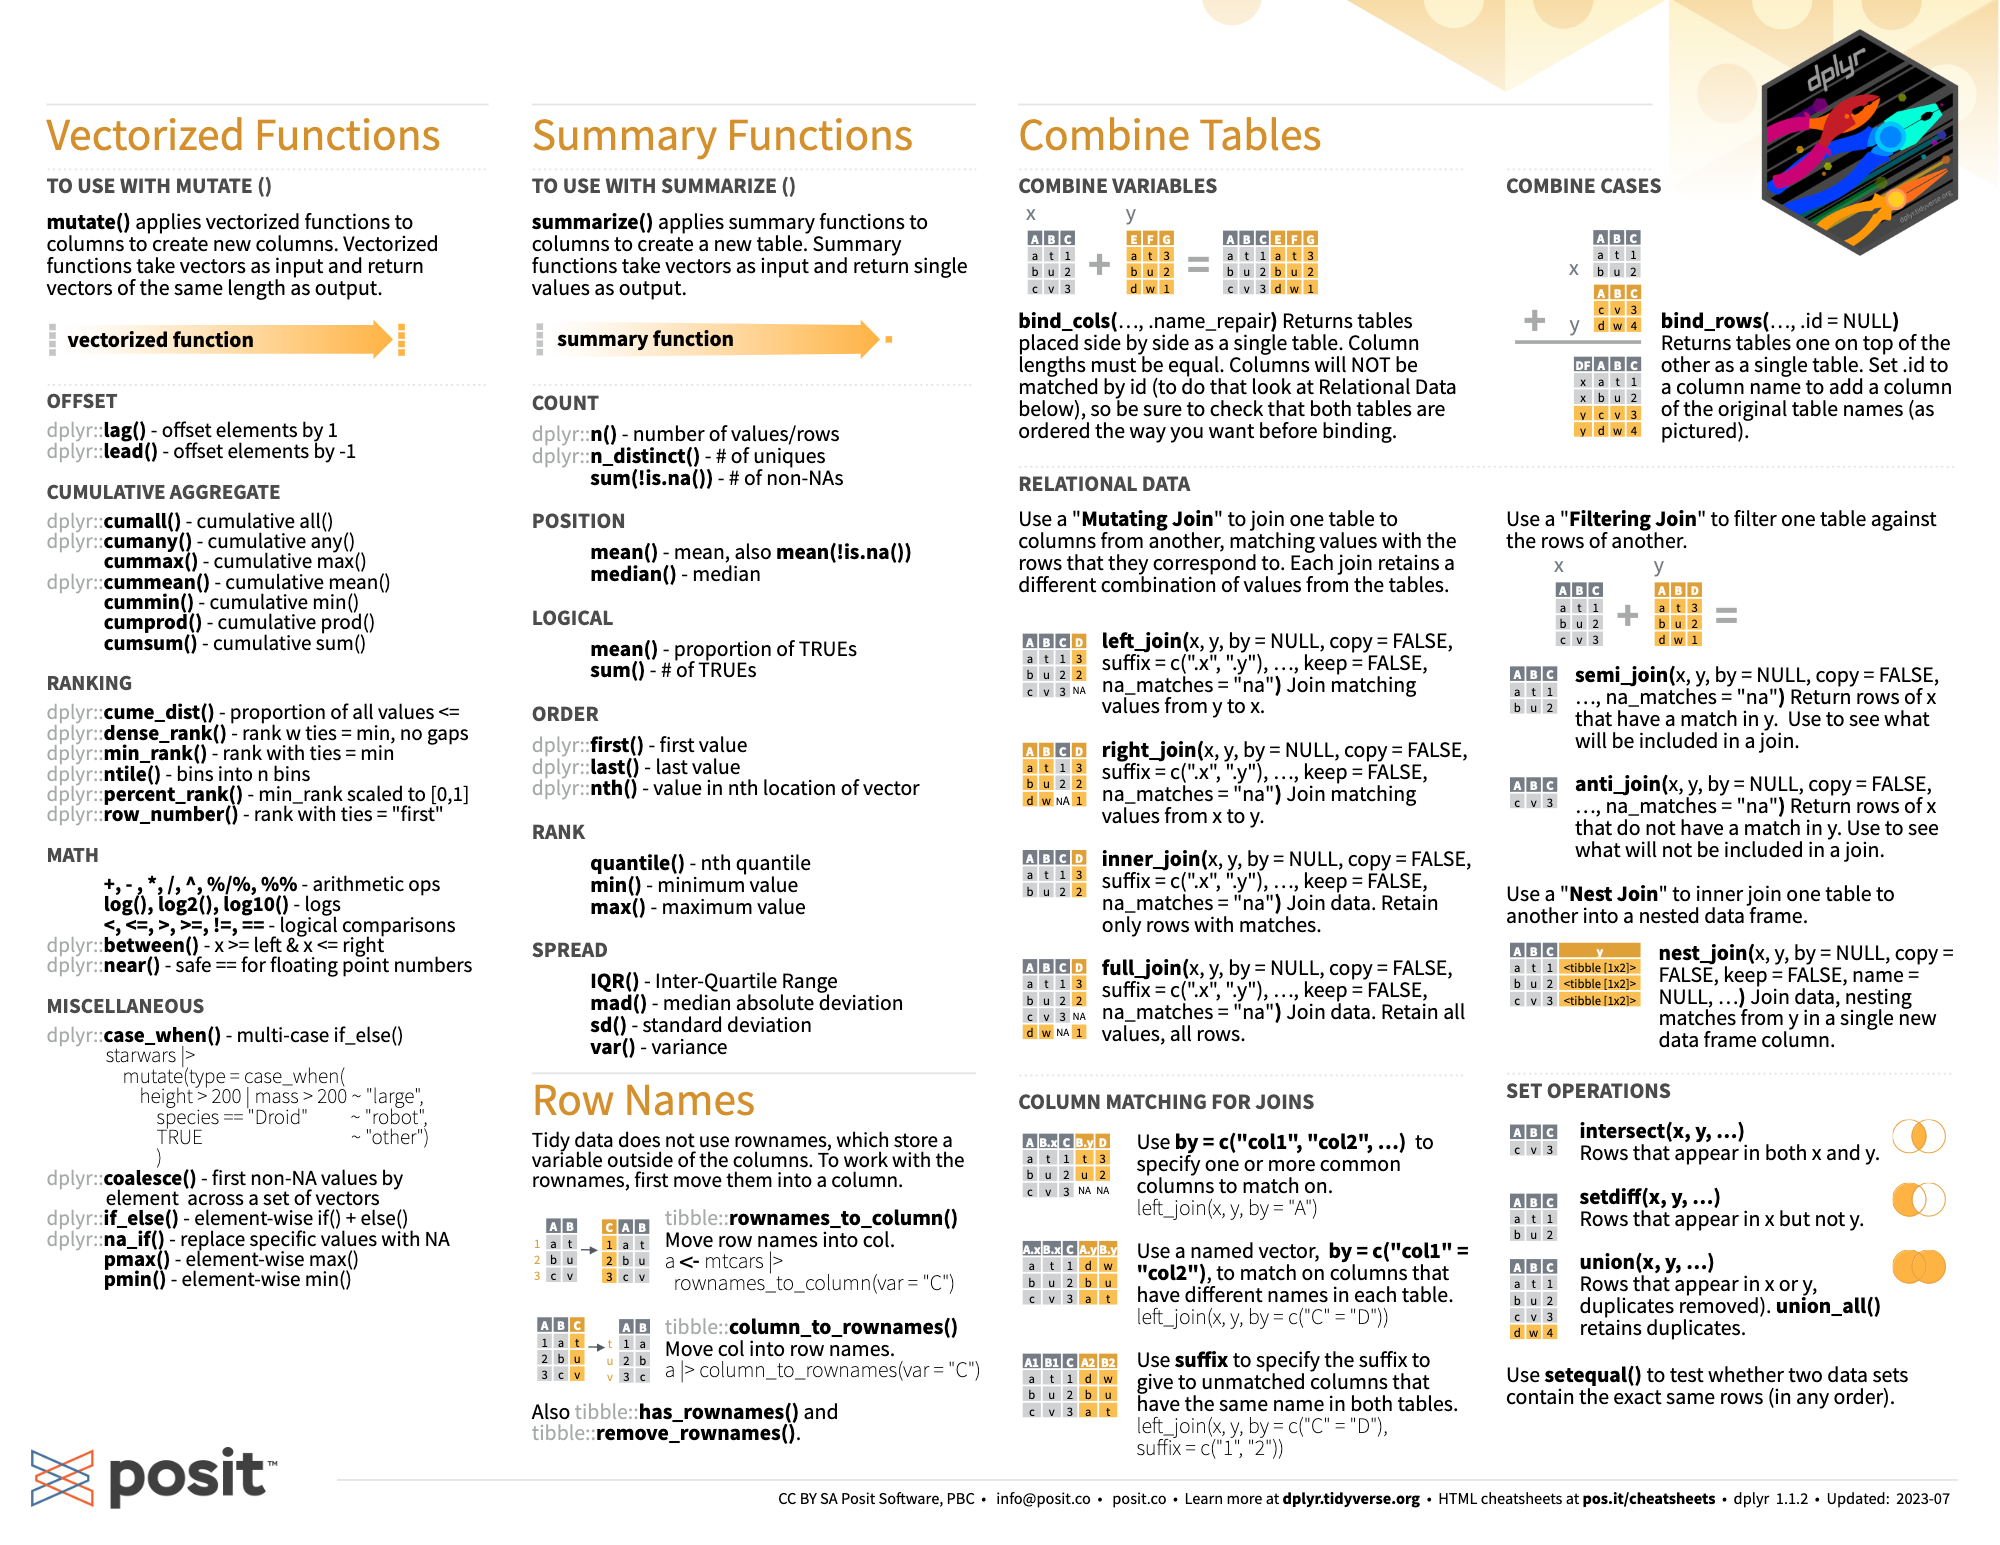
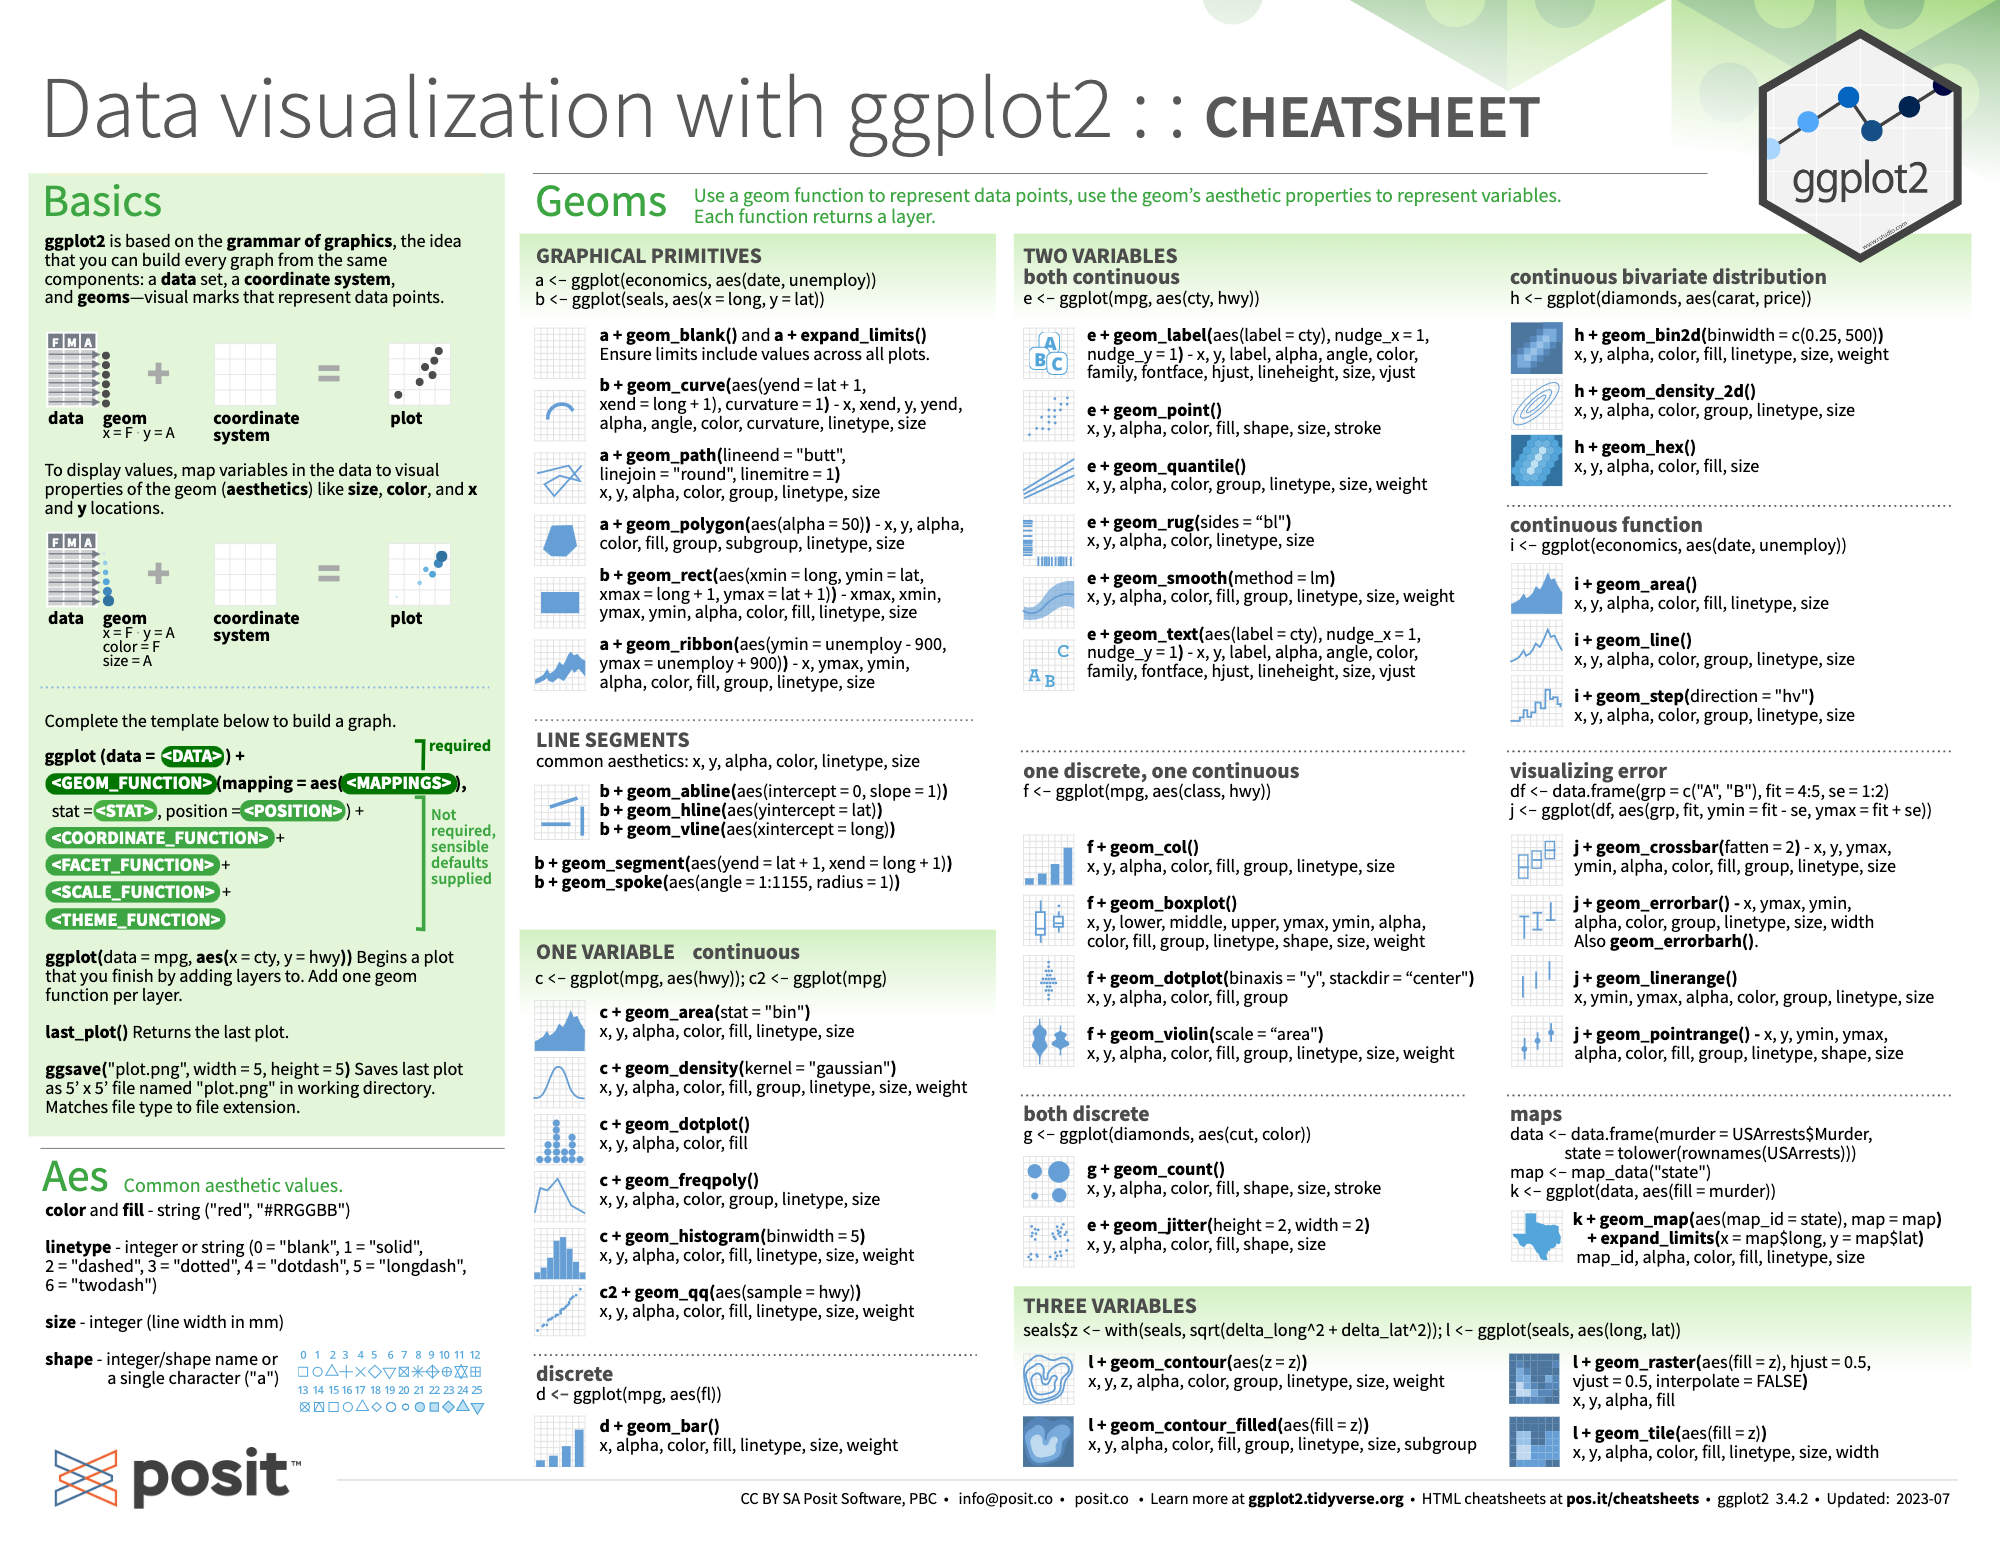
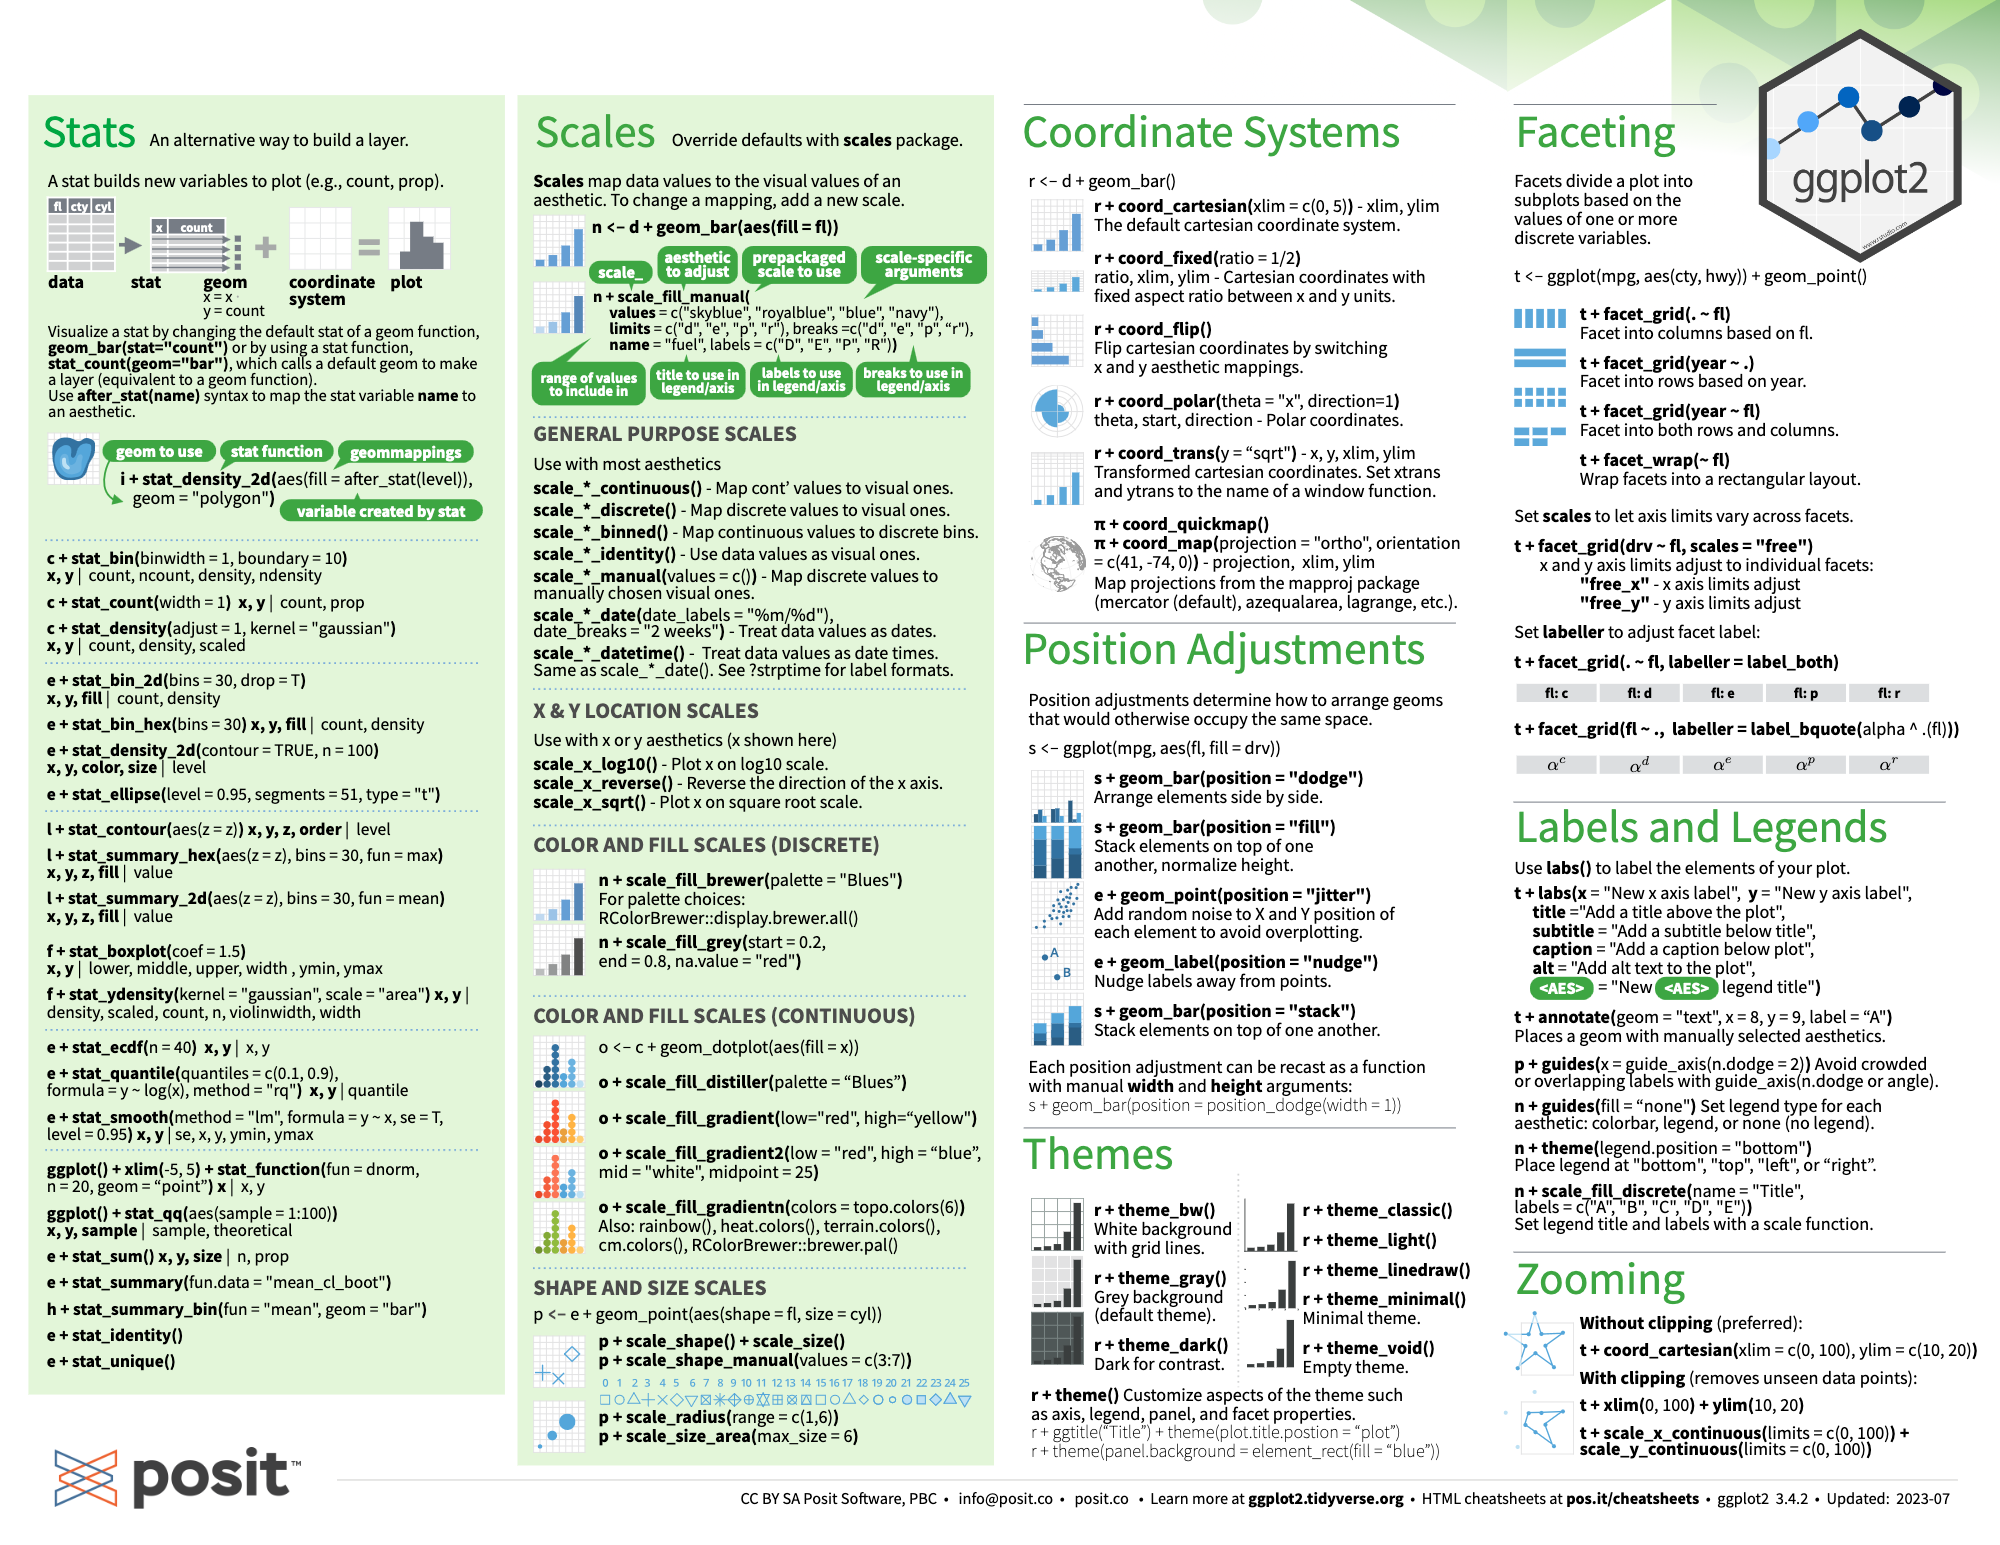
A small sample of ones I use regularly.
A selection that I always seem to refer back to.
Kent D. Lee & Steve Hubbard
Rob Kabacoff
Peter Bruce, Andrew Bruce & Peter Gedeck
Bruno Rodrigues
Alain Zuur, Elena Ieno, Neil Walker, Anatoly Saveliev & Graham Smith
A selection of resources that I have found useful.
Links to original source included.